
Box of maps: spectrograms and Easter eggs
Hiding Easter eggs in spectral content of music


Easter eggs in art
“Easter eggs” (presumably termed because they are fun to find?) are common among media. They reward the diligent fan with a treat that a less serious listener or viewer does not get to appreciate. They become inside knowledge that enhance the lore of a given work and promote engagement about an artistic work outside of the experience. Easter eggs typically have a gimmicky element that risks disrupting the flow by placing an element in plain sight that really does not need to be there. Directors may show up in their own films, scenes may refer to other films, or specific cameos must always occur. Hell, I think I saw one last night in the 2024 Netflix Christmas comedy “Hot Frosty,” when Lacey Chabert notes that a girl on TV (Lindsay Lohan; co-star of the 2004 hit Mean Girls) looks like someone she knew in high school. I’m not sure I recommend this movie, but Easter Eggs are as ubiquitous as fnords if you’re paying attention. To me, the best Easter eggs hide in plain site and kind of feel like the artist saying “Hey! I’m here, and I made this!” And isn’t that what we all want? Just a little acknowledgement and connection?
Musical Easter eggs
Not to be left out of the fun, music has traditionally had its share of Easter eggs. You may have heard about backwards lyrics in the Beatles’ song “Strawberry Fields” creepily saying “Paul is dead” or some whacky stuff about “Hotel California” promoting Satanism. The backward lyrics variety seems to always evokes some kind of conspiracy or Satanic roots—likely because backwards voices sound creepy as hell and probably not far from what Lucifer himself sounds like.
A possibly forgotten relic of the CD era is the “hidden track” Easter egg. Typically a half-baked musical idea captured during the recording session and tacked onto the end of a CD. The “hidden” track seems to be a fairly 90s, early 2000s phenomenon, which makes sense because it was suited well to the CD. Unlike tape or vinyl records before where presumably the cost of the media was proportional to the duration of the music, CDs tend to get pressed with ~72 minutes of available space. With an average rock album clocking in somewhere around 45 minutes, there was ample space to hide Easter eggs. Nirvana’s album Nevermind had one that I remember less for its musical content and more for scaring the shit out of me by blasting through my stereo 20 minutes after the album had finished.
Spectral images
With this general appreciation for Easter eggs, I was excited to learn that some of my favorite electronic music artists got in on the action in a pretty nerdy and awesome way. Instead of inserting vague backwards lyrics or adding hidden songs, these folks incorporated sounds whose spectral content makes an image. The conversion of sound into an image may be familiar from things like sound visualizers (good old Winamp had a few), and this general method can be dialed in to encode a whole image into a song.
Diving a little bit deeper while hopefully not getting sidetracked, let’s consider a spectrum equalizer; a device used to visualize the frequency content of sound playing through it. If sound has more bass, the levels on the far left are higher, and if sound has more highs, the far right will be higher. You may have seen one of these before on a car or home stereo and can envision how the lights may jump in response to a song playing. If we were to take these values are mapped as intensities in space instead of heights on an equalizer, we would get a single line that had bright regions for high intensities and dark regions where there was little frequency content. Since music evolves with time, the high and low intensities that occur throughout a song can be used to create an image that is unique to the sounds: a spectrogram.

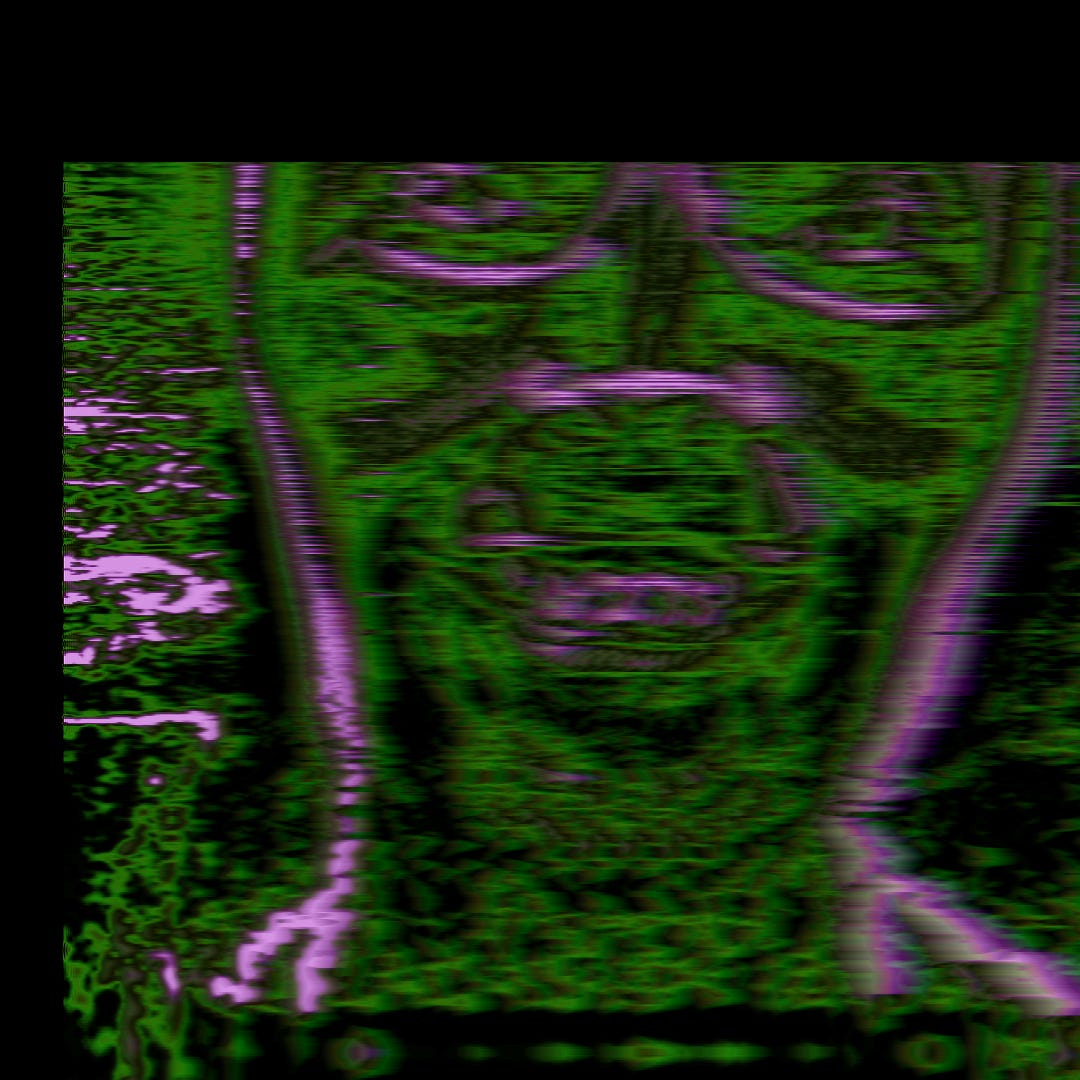
Around the time other artists were hiding tracks at the end of their CDs, some electronic music artists like Aphex Twin saw the spectrogram as a way to insert Easter eggs into their music. I gotta be honest, when I first saw this on Instagram, I thought it was bullshit mainly because the sound generated by a spectrogram that makes an actual image would just sound like static and noise. I was so certain that this gimmick couldn’t be real that I jumped straight into TouchDesigner to make a spectrogram patch because I had to see it with my own eyes. Turns out, images do sound almost completely like noise but it’s entirely possible to hide these sounds in plain sight, especially if the music is complex and experimental.
Make your own spectrogram
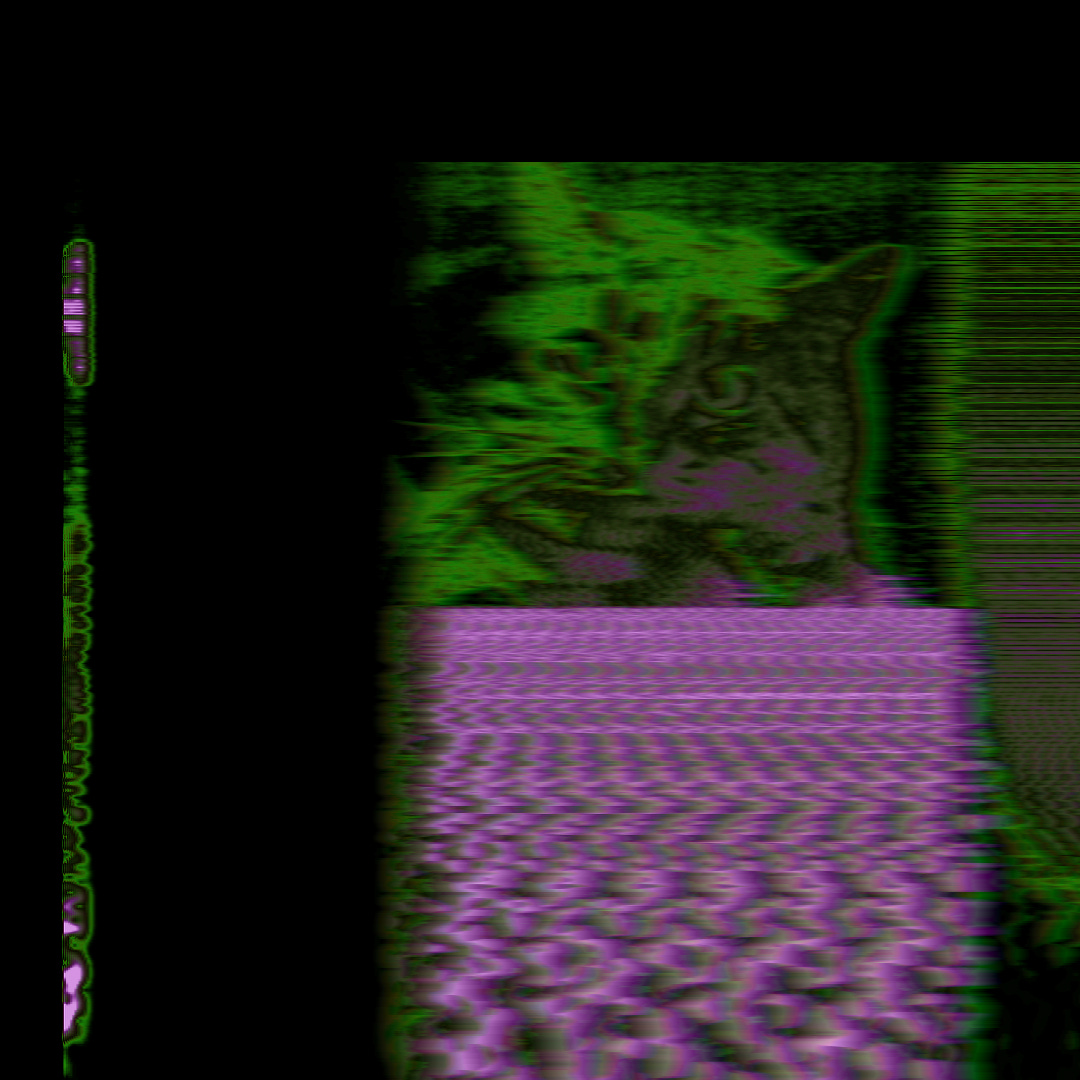
After a quick search around the web, I found a few candidate tracks that claimed to have spectral images, beginning with an Aphex Twin song commonly referred to as “Formula” or “Equation” (due to its real name being an actual long equation). Another was by the band Venetian Snares which apparently has images of cats. I launched off into TouchDesigner land to visualize this process.
Quick code section
You can skip this if you’re not into TouchDesigner or signal processing. Otherwise, you can download a .toe-file for the spectrogram at my github. There are spectrogram tutorials on YouTube, so I’ll keep this brief. To make a spectrogram, you need to convert the audio to the frequency spectrum and then get it into a form that can be visualized (Fig. 1). The top row reads the file with an AudioFileIn, scales it, and then takes the spectrogram. The bottom row gives the coordinates of a column of points in X,Y, and Z coordinates. We then resample the audio spectrum to be the same size as the column of points that we ultimately use to instance a bunch of rectangles (each instance representing a specific frequency). This is then passed into a feedback loop so that the spectral content scrolls across the screen.

Please let me know if you try this code or if you can think of better ways to make a spectrogram. I couldn’t figure out how to reduce the blurring in my feedback loop, but I also thought it looked alright on the output.
Easter eggs in conclusion
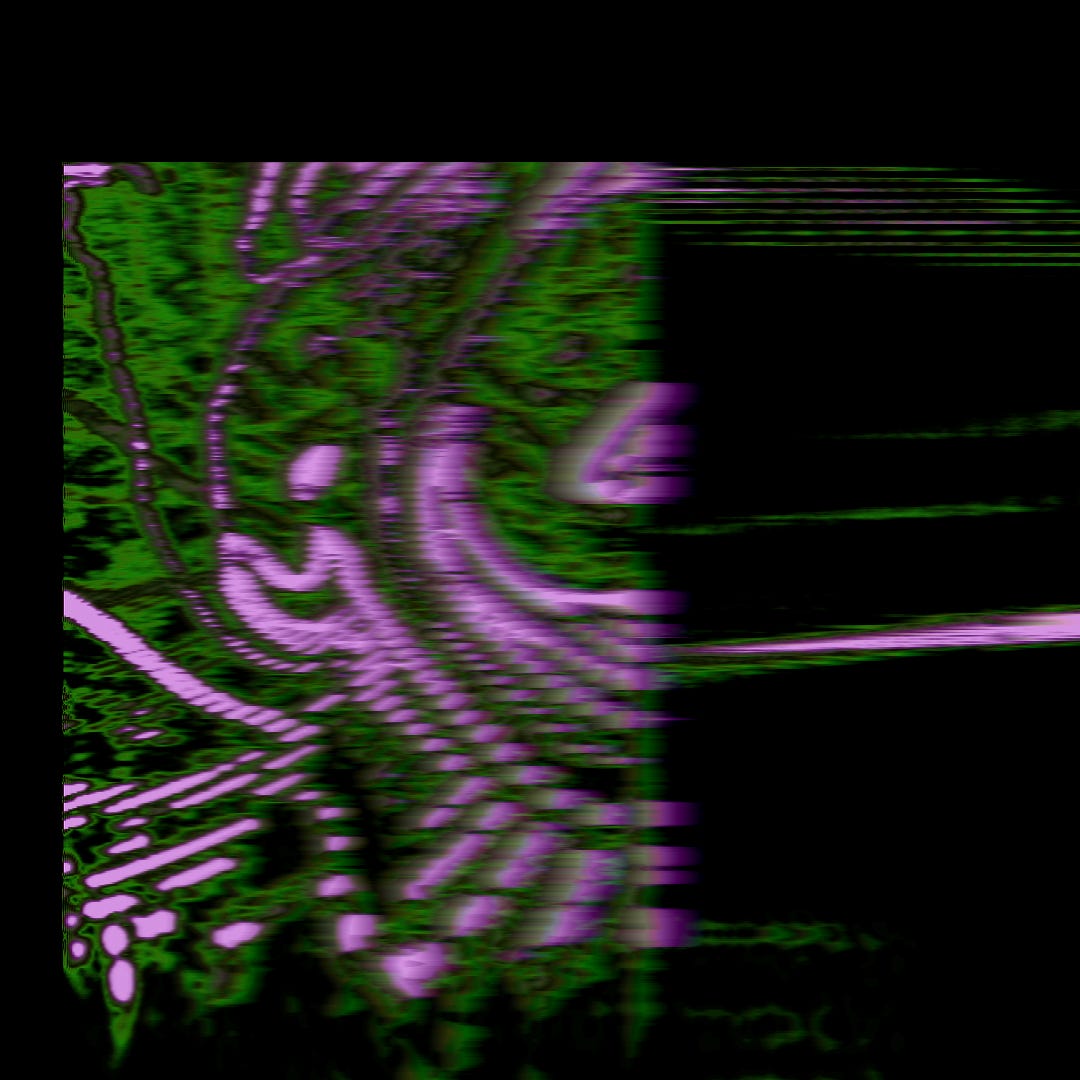
I hope you’ll have fun with the spectrogram program if you decide to mess with it. I was able to find the Richard D. James face in “Formula” and a few more, including an amazing picture of a cat (see below). Spectrograms are generally pretty fun to work with and good tools for visualization, and that’s why they earned their place in the Box of Maps. Do you know of any other spectral Easter eggs? Have any favorites from movies, books, or music that you remember? Let me know about them if you feel inclined. Thanks for reading.
Some outputs
Love this! Such a cool idea.